Opto22 SOP
Standard Operating Procedure
Introduction
The Opto22 control system automates and monitors industrial processes with advanced control and data acquisition capabilities. This SOP provides a basic overview on how to operate the Opto22 control software.
Procedures
Startup
- Open the ‘Pac Display Runtime’ file pinned to the taskbar of the computer.
- Two windows should open, the ‘Pac Display Runtime’ and an ‘Event Log Viewer.’
- In the ‘Event Log Viewer’ check to see if there are any error messages. The window should look similar to that in Figure 1. If there is an error, contact lab personnel. Otherwise, feel free to minimize or close the ‘Event Log Viewer.’
- Once the program is open you should see a screen similar to that in Figure 2. If your screen does not look like this; any of your numbers display around -3000, or are highlighted in red contact lab personnel.
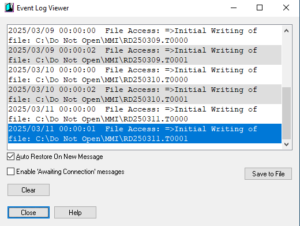
Figure 1: Example of ‘Event Log Viewer’ window with no error messages.
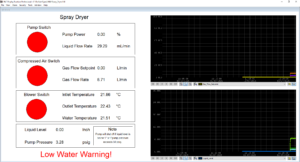
Figure 2: Example of the Opto22 control system.
Basic Controls
- If there are any red circles on the display labeled “_____ Switch”, they must be turned on first before you can control their respective device.
- To turn the on switch press on the red circle. This should cause it to turn green as seen in Figure 3, indicating that it is now on.
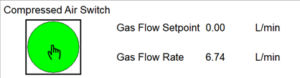
Figure 3: Example where the Compressed Air Switch has now been turned on.
- Once the device has been turned on you can control the outputs by clicking on the numbers you wish to change. Note: Only the output variables on the screen can be controlled. To determine if the number is an output variable hover the mouse over the number, if a box appears around the numbers they are an output variable.
- After clicking on the numbers a box titled “Send Value” should appear as shown in Figure 4. In this pop-up enter the desired change. Make sure that whatever number inputted is within the range indicated on the pop-up. Click ‘OK’ to enter the new value.
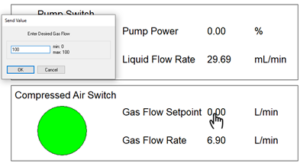
Figure 4: Imputing a new output into ‘Gas Flow Setpoint’.
- After you have set all of your output variables to the desired values you can track the input data on the linked plots (If applicable).
- To view the legend for each graph, click on the dropdown arrow as indicated in Figure 5.
- Each line can have different y-axis scaling. The scale that is shown on the left of the graph will only match that of the line currently selected.
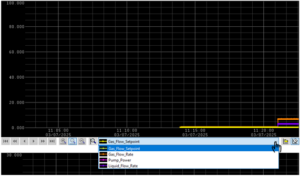
Figure 5: Example of the dropdown menu of a plot.
- The desired the range of each line can be modified. To do this, select the line to be modified from the dropdown menu and then click the magnifying glass directly to the left of the dropdown bar as shown in Figure 6.
- This will open a pop-up titled “SuperTrend Pen Scale”. In this menu you can enter new minimum and maximum values for the selected line. Click ‘OK’ to enter new values. Note: This will only affect the scale of the selected line. All other lines will remain unchanged until they are modified individually.
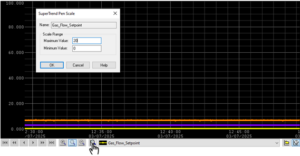
Figure 6: Scaling the ‘Gas_Flow_Setpoint’ line down from 0-100 to 0-20.
Exporting Data to Excel
- All of the data visible on the Opto22 control software is automatically saved to a folder on the desktop titled “DATA” or a similar name. Open this folder.
- Inside of the folder will be many files titled “RD######”. Locate the file that corresponds with the date/time that you ran your experiment. Note: The computers in the lab are not on the network and as such, may not have the right date/time. Your file will correspond with whatever date/time the computer shows.
- DO NOT open this file! Doing so, while the control software is running, could cause the system crash. Instead make a copy of this file and save it either to a flash drive or separate folder.
- Open Excel and go to File→Open→
- In the file explorer click the dropdown arrow on the bottom right of the screen as shown in Figure 7. Select ‘All Files’.
- Locate your data file and open it.
- A pop-up titled “Text Import Wizard” should open.
- Make sure that ‘Delimited’ is selected as shown in Figure 8 and click ‘Next’.
- Make sure that ‘Comma’ is set as a delimiter as shown in Figure 9 and click ‘Finish’.
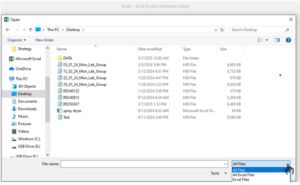
Figure 7: Opening the Opto22 data file in Excel.
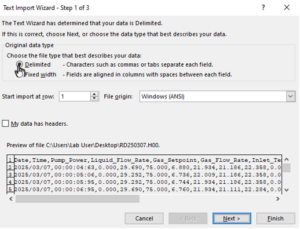
Figure 8: Setting the file excel file type to delimeted.
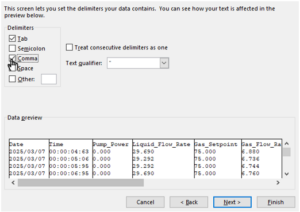
Figure 9: Setting comma as a delimiter.
- Your file should now open which each of the Opto22 control variables in their own column. This data is usually all of the readings for the whole day, as such use the time of your experiment to filter through the data till you find the portion that corresponds to your experiment. Note: This will almost always be the end of the data so start from the end and work up.
Shutdown
- Make sure everything on the Opto22 display are turned off and set to 0.
- Exit the Opto22 control software using the red ‘X’ at the top right of the screen as shown in Figure 10. DO NOT shut down the computer.
- Save your data to a flash drive or device if not already done.
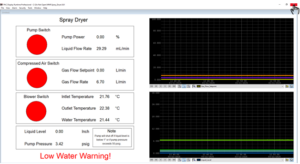
Figure 10: Exiting the control software.